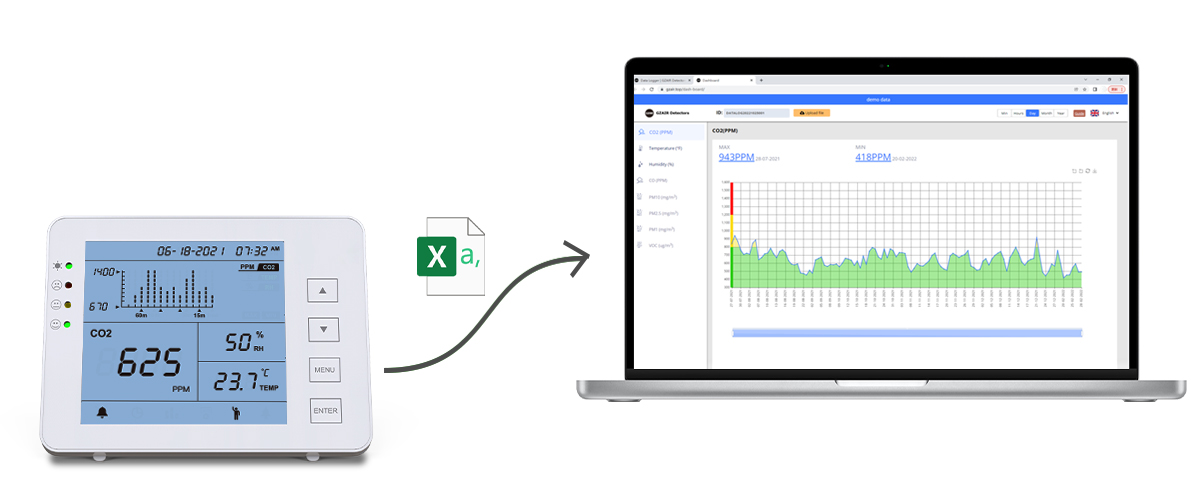
View Your Data on Dashboard

All previously measured data of GZAIR Model 1200P is stored on the memory card and can be viewed in the free digital dashboard. You can connect the monitor to your computer with the supplied USB cable. The ‘GZAIR’ folder will automatically open on your computer. This GZAIR folder contains a .csv file that can be uploaded on our website: https://www.gzair.top/dash-board/.
Step 1. Go to https://www.gzair.top/dash-board
Here you see a dashboard with graphs of CO2, temperature and humidity. When you open the page for the first time, the dashboard is filled with demo data. Please note: this is not your own data yet. At the top right, you can set the desired language.

Step 2. Upload your .csv file in the dashboard
Click on “Choose file” at the top right to upload a .csv file. Go to the folder where you saved the .csv file. Select the file and then click the “Upload” button to place the selected file in the dashboard.

Step 3. Overview of historical data
After uploading the file you will see three tables containing your historical data of CO2, temperature, and humidity. At the top left, you can choose the start and end date between which you want to view the data. You can use the buttons to indicate whether you want to view the data in hours, days, months, or years.

